How to Read a Circular Chart Recorder? – Detailed Guide
In the majority of industrial processes, real-time monitoring of such key parameters as temperature, pressure, and flow rate is essential. The circular chart recorder, a traditional but useful recording device, remains popular in such fields as pharmaceuticals, food processing, chemical manufacturing, HVAC, and energy. So, how to read a circular chart recorder?
Today, in this article, we are going to take you through everything you want to know, from its working principle to effective reading techniques, in order to help you fully comprehend the instrument.
Part 1. What is a Circular Chart Recorder?
A circular chart recorder is an instrument that graphs measurement information with time on a rotating circular chart. It has very common uses in constantly observing the change in parameters such as temperature, pressure, or flow rate.
Its greatest advantage over digital recording instruments is its visual form and independence from complex electrical systems, it is able to function even under powerless or computer-less conditions.
The common operating principle is as follows:
- The sensor senses the measured signal → drives the recording pen → draws a curve on the revolving chart.
- Operators can easily see the machines’ operating conditions and detect changes in parameters merely by glancing at the chart.
Common Application Fields:
- Food & Beverages Industry: Temperature measurement during baking, cooling, or fermentation processes
- Pharmaceuticals & Labortories: Temperature recording in sterilization and refrigeration processes
- Chemical & Energy Industry: Pressure and flow measurement
- HVAC Systems: Monitoring changes in ambient temperature and humidity
Part 2. Main Components of a Circular Chart Recorder
Prior to learning the art of reading the chart, it’s essential to grasp the major elements of the device. A common circular chart recorder has the following elements:
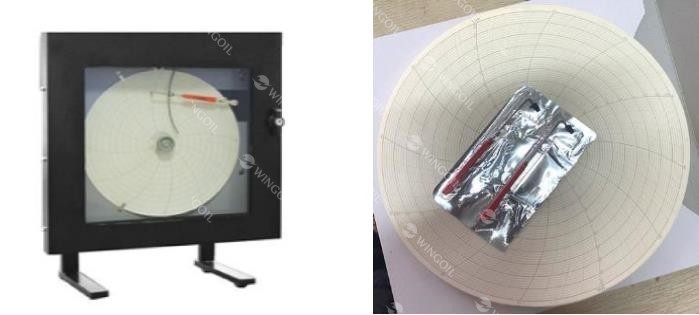
- Chart Paper: Is circular chart paper that is marked with time and measurement graduations. The standard cycles are 24 hours or 7 days, and one full rotation of the chart is a full cycle.
- Recording Pen (Pen Arm): Converts the sensor signal into a chart trace. Different colors are often used to distinguish between multiple channels (e.g., red for temperature, blue for pressure).
- Central Drive Mechanism (Clock Drive): Controls the speed of chart rotation so that the time scale can match the actual time correctly.
- Scale & Calibration: Used to place the measuring range, such that the readings are accurate.
- Input Signal: Obtained from sensors such as temperature sensors, pressure transmitters, or flow meters.
These instruments collaborate to graphically record constantly fluctuating information, rendering it easy to analyze and observe process trends.
Part 3. How to Read a Circular Chart Recorder: Step by Step Guide
It may seem that reading a circular chart recorder is a complicated process, but if you follow the correct steps, it will be quite simple to interpret the data to your satisfaction. Here is a step-by-step standard procedure:
Step 1. Check the Time Scale
- Begin by locating the rotation cycle of the chart—24 hours or 7 days.
- Most time scales are marked along the outside, typically with one tick mark per hour.
- Start in the center and go clockwise, the direction of forward passage of time.
- It is essential to know the direction of time because all measurements are relative to particular times on the graph.
Step 2. Locate the Variable Scale
- Measurement values, i.e., temperature (°C / °F) or pressure (bar / psi), are usually noted along the inner circle or outer circle of the chart.
- Some recorder models may have varying scale ranges, so ensure that the chart paper is aligned according to the fixed measurement range of the device.
- Proper alignment allows accurate reading of the parameter at any given instance.
Step 3. Note the Pen Traces
Each pen is an observed channel. A few recorders have multiple pens with different colors. Trace the pen’s movement along the chart to see how the values evolve over time. For example:
- An outward-moving curve typically indicates an increase in the parameter (e.g., increasing temperature).
- An inward-moving curve indicates a decrease in the parameter.
- Watch for sudden spikes or dips, since these may represent unusual events or variation.
Step 4. Interpret Data Trends
Look for the general trend and direction of the curves to discern patterns:
- Look for unusual fluctuations or drastic changes.
- Check if the parameters cross predetermined thresholds.
- Judge if the system is running smoothly in the long term.
For example, if the curve at 3:00 PM hits 100°F, it indicates the temperature at that particular moment reached 100°F.
Trend analysis allows operators to foresee potential problems and schedule maintenance or adjustments.
Step 5. Record Key Readings
For future reference or for reporting purposes, it is advisable to note the readings at some time points, i.e., startup, alarms, or shutdown.
Having these critical values recorded will allow you to monitor performance, trend against the past, and generate credible reports.
Part 4. Common Mistakes When Reading a Circular Chart Recorder
Even professional operators may make mistakes interpreting chart data. Knowing these common errors and avoiding them is crucial to maintaining accurate and reliable readings.
| Common Mistake | Cause | Recommended Solution |
| Confusing chart cycle | Not paying attention to whether the chart is 24-hour or 7-day | Always verify the chart’s cycle before reading to ensure time references are correct |
| Reading the wrong scale | Chart paper does not match the device’s measurement range | Check that the chart type, scale, and units correspond to the recorder settings |
| Faint or overlapping pen traces | Chart paper not replaced in time or ink has dried | Perform regular maintenance, replace chart paper and pens on schedule |
| Ignoring time deviation | Clock drive errors or temporary system stoppage | Calibrate the clock mechanism regularly and adjust for any downtime |
| Channel confusion | Multiple pens not clearly distinguished | Use standardized pen colors and labels to differentiate channels clearly |
By avoiding these mistakes, operators can ensure the data gathered is traceable, correct, and reliable, something that is fundamental for process monitoring, quality control, and regulatory compliance.
Accurate reading not only aids everyday working but also provides valuable information for troubleshooting, trend analysis, and long-term process optimization.
Part 5. Circular Chart Recorder Calibration and Maintenance Tips
Calibration and maintenance of circular chart recorders regularly are required to record consistent and accurate data. Some helpful tips are given below:
- Company Regularly Calibration Sensors and Clock Drives
Sensor calibration and clock drive calibration are necessary to prevent drifts in time or measurement values. By ensuring that sensors are recording accurately and that the chart is spinning at the required speed, you ensure homogeneity and accuracy in all recorded data, particularly for important processes that need to be monitored with high accuracy.
- Keep Recording Pens Clean
Kept tidy, recording pens prevent gaps, smudges, or false traces resulting from dried-out ink or dirt. From time to time, checking and cleaning the pen mechanisms will provide smooth, even lines and will ensure that recorded data accurately portrays real-time variations in the monitored parameters.
- Replace Chart Paper in a Timely Manner
Replacing chart paper according to the chart cycle is required for clear and legible recording. In the case of 24-hour charts, change the chart on a daily basis, and 7-day charts need to be changed weekly. Repeating replacement prevents overlapping traces and ensures that all measurements are clearly recorded.
- Use Original Accessories and Paper
Using factory-provided pens and chart paper assures proper scale alignment and accurate readings. Use of non-standard accessories to replace existing ones can create misalignment, scale incompatibility, or erroneous data interpretation, negating the validity of your monitoring system.
- Archive and Digitize Charts
Scanning and digitizing paper charts enables long-term archival, simpler trend analysis, and effective reporting. Having digital copies in addition to physical charts enhances traceability, streamlines process audits, and minimizes the loss of data, making it simpler to access historical information and make effective operational decisions.
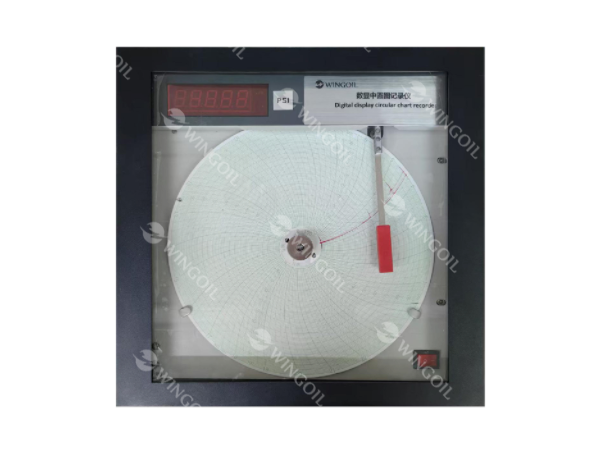
Part 6. Why Select Wingoil Mechanical Circular Paper Chart Recorder?
Wingoil Mechanical Circular Paper Chart Recorder provides a cost-effective and reliable method of continuous pressure, temperature, or both measurement in industrial applications.
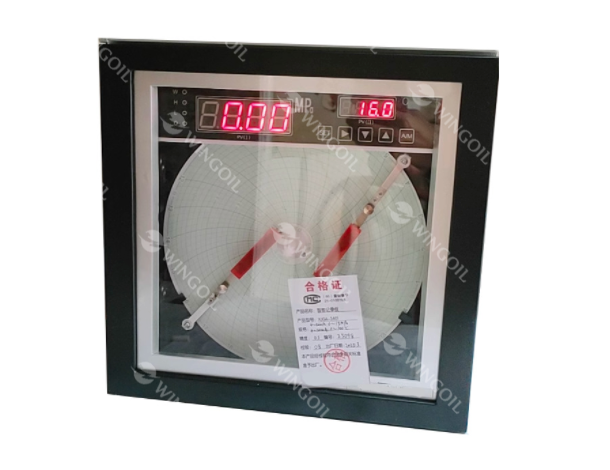
Ruggedly constructed for usage by different industries, these recorders are available in single-pen and dual-pen designs with 9-inch or 12-inch chart sizes and 1% measurement accuracy, allowing them to be most suitable for a wide spectrum of industries including oil & gas, petrochemical, food & dairy, and pharmaceuticals.
Their heavy-duty epoxy-coated steel housing offers panel, wall, or pipe mounting, and mechanical or battery-powered chart systems offer continuous operation in harsh or inaccessible areas.
Key Advantages of Wingoil Circular Chart Recorder:
- Versatile Recording Capabilities – Single-pen pressure alone, dual-pen pressure and temperature recording.
- High Accuracy & Reliability – 1% measurement accuracy with long-proven mechanical design.
- Rugged and Portable – Heavy-duty steel epoxy-coated case perfect for general mounting and portable use.
- Wide Industry Application – Perfect for processes from dairy pasteurization to hydrostatic pressure testing.
- Extensive Accessories Support – Extensive line of pens, charts, and accessories, compatible with other manufacturers’ recorders.
If you require a round chart recorder that will be dependable over the long term and is easy to read and maintain, please call Wingoil for a quotation or a customized solution.
Wrap Up
Understanding how to read a circular chart recorder allows you to quickly understand the working condition of your equipment within seconds and enhance production monitoring and quality control. Knowing the chart pattern, easily reading the scale marks, and having the instrument calibrated, you can readily obtain vital information from a single circular chart.
Whether in a production laboratory or on a production line in industry, circular chart recorders remain a rugged, easy-to-read, cost-efficient monitoring instrument. If you need more performance or more specialized recording capabilities, Wingoil’s professional team is always ready to help.